Supporting Information
Coordination among metabolism, cell growth and division
mRNAs coding for ribosomal proteins (RPs)

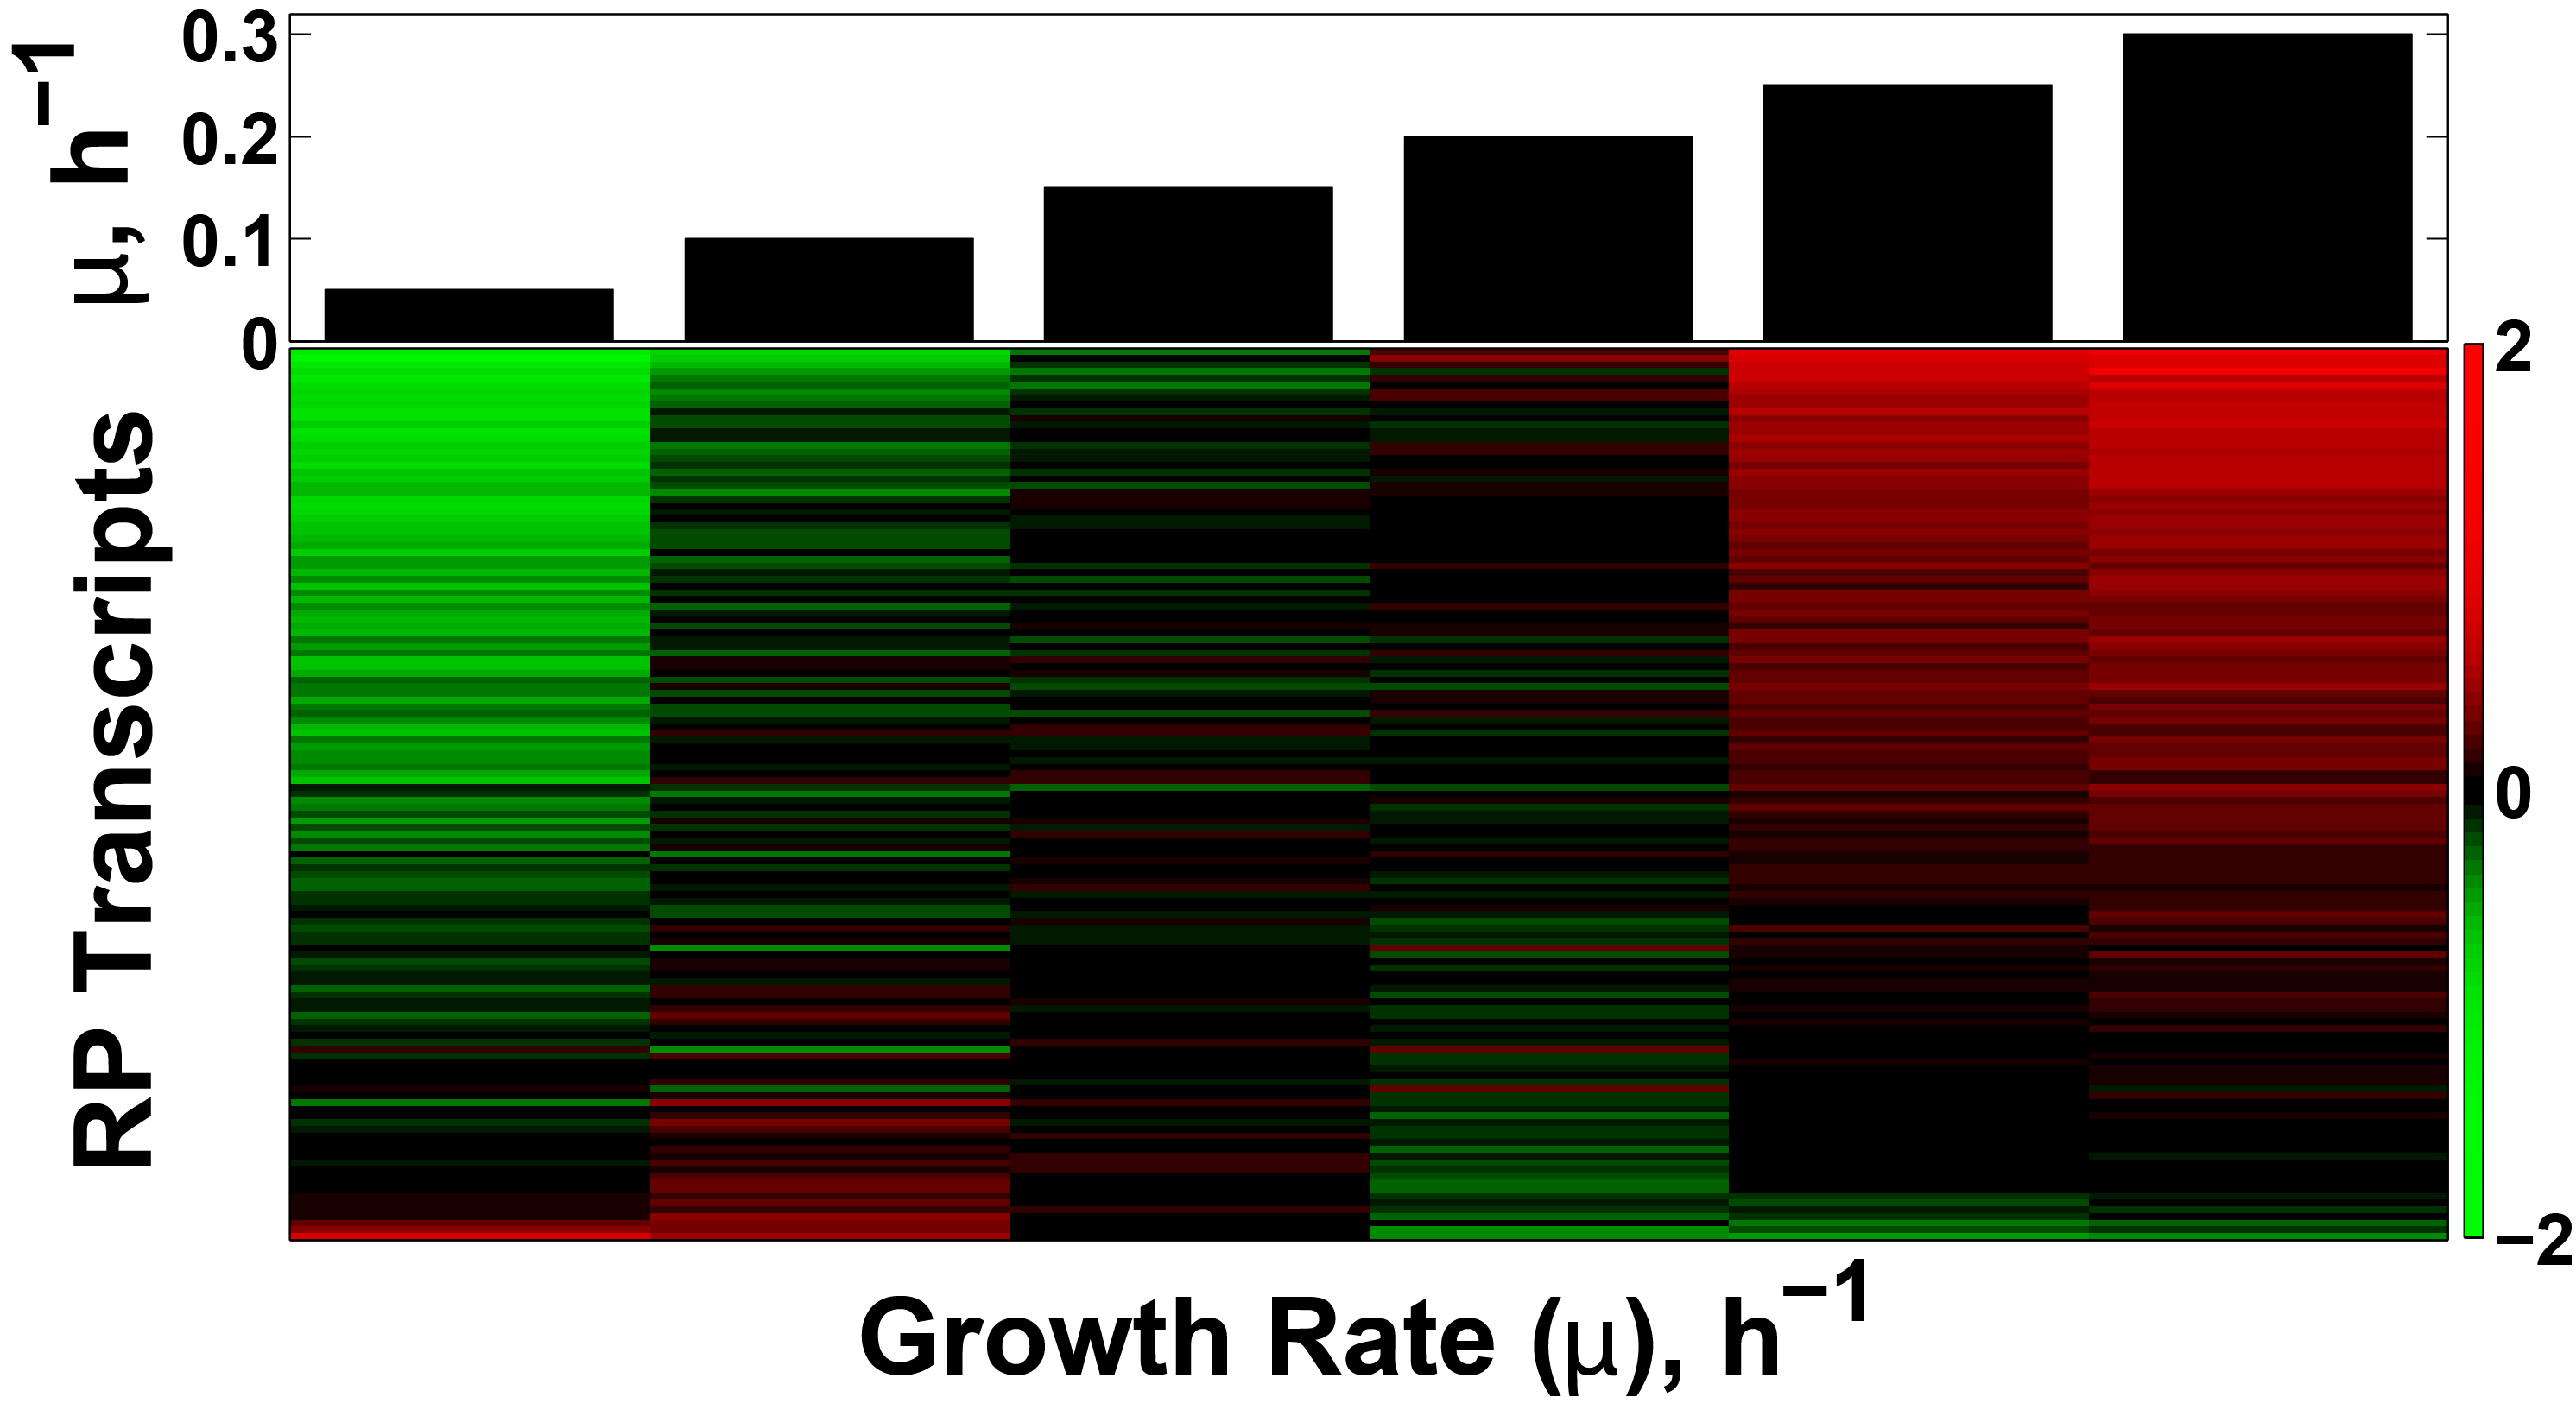
Different RPs have different magnitudes of their growth-rate responses, i.e., transcriptional induction or repression with increasing growth rate
The heatmap displays transcript levels of RPs in yeast cultures growing at steady-state in glucose-limited minimal media at the growth-rates (μ) indicated by the bars on the top. To emphasize the growth-rate trends, the mRNA levels of each RP are displayed on a log2 scale relative to their mean across all six growth rates. The RPs are sorted by their growth-rate slopes to emphasize the variability of their slopes, from highly positive to negative.